technical analysis is an analysis methodology for analysing and forecasting the direction of prices through the study of past market data, primarily price and volume. As a type of active management, it stands in contradiction to much of modern portfolio theory.
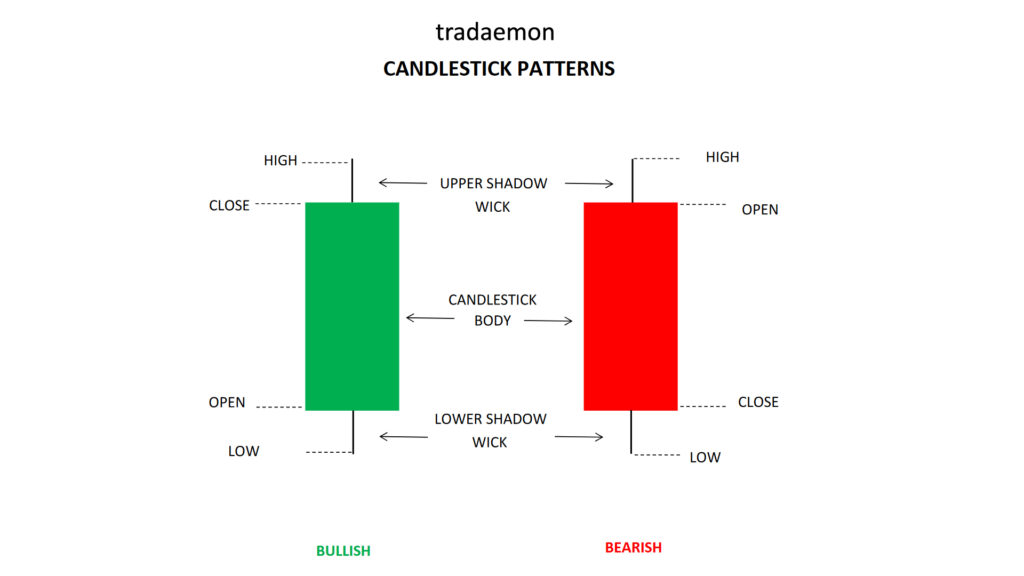
A candlestick pattern is a movement in prices shown graphically on a candlestick chart that some believe can predict a particular market movement. The recognition of the pattern is subjective and programs that are used for charting have to rely on predefined rules to match the pattern.
Candlesticks Pattern
Chart Pattern
A chart pattern or price pattern is a pattern within a chart when prices are graphed. In stock and commodity markets trading, chart pattern studies play a large role during technical analysis. When data is plotted there is usually a pattern which naturally occurs and repeats over a period. Chart patterns are used as either reversal or continuation signals.
In technical analysis in finance, a technical indicator is a mathematical calculation based on historic price, volume, or (in the case of futures contracts) open interest information that aims to forecast financial market direction. Technical indicators are a fundamental part of technical analysis and are typically plotted as a chart pattern to try to predict the market trend.
Technical Indicators
Say No To Tips | Be Skilled Be Safe
TRADAEMON
Tradaemon is an online learning platform for online stocks trading related services.
Important Links
Who We Are
Privacy Policy
Terms & Conditions
Courses
Candlestick
Charts
Indicators
Products
Technical Analysis
Fundamenta Analysis
Copyright 2023 Tradaemon , All Rights Reserved. Design & Developed by Glamsure.